A national crisis by the numbers

Right now, there are too many jobs without people to fill them. As a result, businesses can’t grow, compete, and thrive. The U.S. Chamber and Chamber Foundation’s America Works initiative is mobilizing business and government to swiftly address the crisis.
This page captures the trends on job openings, labor force participation, quit rates, and more, for a quick understanding of the state of the workforce. Take a look behind the numbers at what is causing the worker shortage and learn which states and industries have been impacted the most.
The U.S. has lost millions of workers.

-
62.1%
labor force participation rate -
3.4M
workers that have left the labor force since Feb. 2020
The latest jobs report from the Bureau of Labor Statistics showed that thousands of people are entering the workforce. This is good. However, labor force participation does not match what it was before the pandemic.
If the percentage of people participating in the labor force was the same as in February 2020, we would have 3.4 million more people in the workforce today—and this shortage is impacting all industries in every state. If every unemployed worker took an open job in their industry, there would still be millions of open jobs.
Where did the workers go? Boosted unemployment benefits, stimulus payments, and child tax credits have padded the finances of some previously employed workers, and they no longer need to work. Plus, early retirements and less immigration has left the nation in a worker deficit.
- Analysis: Learn the industries impacted the most
- Download the Data: Labor force by industry

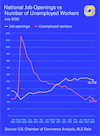
We have a lot of jobs, but not enough workers.
-
10.7M
open jobs in the U.S. -
5.7M
unemployed workers in the U.S.
If every unemployed person in the country found a job, we would still have 5 million open jobs.
How did this happen? At the height of the pandemic, more than 120,000 businesses temporarily closed, and more than 30 million U.S. workers were unemployed. Since then, job openings have continued to climb, while unemployment has slowly declined.
- Analysis: Learn the reasons behind the worker shortage
- Download the Data: National job openings and unemployment
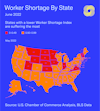
Every state is feeling the impact of the worker shortage.
-
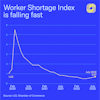
66
workers for every 100 open jobs in the U.S. -
30
workers for every 100 open jobs in Minnesota
The Chamber’s Worker Shortage Index number indicates the number of available workers for every job opening. Minnesota, with the lowest ratio of 0.30, is suffering the most as workers leave the state to pursue opportunities and education elsewhere, without new workers coming in.
Only New York has a Worker Shortage Index above 0.9, meaning it is the closest state to having roughly equal numbers of available workers and job openings. There are no states right now that have a surplus of workers.
- Download the Data: Worker shortages by state
The Great Resignation is more like ‘The Great Reshuffle’
-
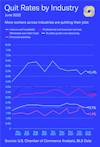
2.8%
national quit rate -
4.2%
national hiring rate
The Great Resignation has pulsed through media headlines. However, ‘The Great Reshuffle’ is a more accurate explanation of the changes taking place in the workforce. The rate at which employees have quit their jobs has grown over the past year. But at the same time hiring continues to outpace quits.
- Analysis: Learn the reasons behind the worker shortage
- Download the Data: National quit rates and hiring rates

Job openings have increased by 15% or more in every state since February 2020.
-
Kentucky
highest percent increase in job openings
-
Oregon & Alaska
lowest percent increase in job openings
Every state has more job openings today than it had before the pandemic. Job openings have doubled in Kentucky, with Hawaii and Minnesota close behind. Alaska, Oregon and West Virginia had smaller increases, but still jumped an average of 32% from Jan. 2020 to June 2022—a sign that businesses are still creating jobs across the nation.
Prior to the pandemic, 11 states had more than 200,000 job openings. That number has grown to 22 states, as of June 2022. Sixteen states had fewer than 50,000 vacant jobs just prior to the pandemic. Now, that number has shrunk to 11.
- Download the Data: Worker shortages by state

The Great Reshuffle has affected some industries more than others
-
5.5%
quit rate for leisure and hospitality industry -
1.5%
quit rate for the financial activities industry
The Great Reshuffle has affected some industries more than others. Workers in traditionally lower paying industries, including leisure and hospitality and retail, have been most likely to quit their jobs. Meanwhile, in more stable, higher paying industries, the number of employees quitting has been lower.
- Analysis: Learn the industries impacted the most
- Download the Data: Labor force by industry
Employers are responding quickly to the worker shortage, deploying new strategies to attract and retain a talented workforce. As the labor market continues to shift, and workers obtain new skills to gain employment in different industries, our labor pools take different shapes.
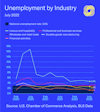
Workers in industries that require specialized skills or training, like financial activities and durable goods manufacturing, are experiencing relatively low unemployment rates. Conversely, workers in industries that offer a large number of entry level jobs—leisure & hospitality and wholesale & retail trade—have unemployment rates greater than the national average.
Through the America Works Initiative, we’re helping employers across the country develop and discover talent to fill open jobs and grow our economy. Learn more.


