How Government Benefits Programs Are Contributing to the Labor Shortage

During the pandemic, the government infused trillions of dollars into the economy to help Americans stay afloat during the height of business closures, layoffs, and uncertainty. Millions of Americans benefited from pandemic relief payments, enhanced unemployment benefits, and bolstered social programs.
These support mechanisms provided necessary help to many families during difficult times, but these same programs can discourage Americans from joining or rejoining the workforce—especially when increased earnings do not make up for the loss in benefits.
As businesses continue to grapple with a national workforce shortage, a flawed government benefits framework is one of many factors keeping Americans on the sidelines of the labor force.
This page dives deep into the affect pandemic benefits had on American’s financial wellness and unintended “benefit cliffs,” the point at which benefits are cut off, which can discourage labor market participation.

The impact of enhanced unemployment benefits
During the pandemic, more than 20 million Americans received unemployment insurance (UI) benefits. From March 2020 to September 2021, the federal government provided an additional $300 – $600 a week to any person who was earning at least $1 in UI benefits.
The enhanced UI benefits were generous compared to regular UI benefits. On average, UI typically replaces 38% of a claimant’s average weekly wage.
The enhancement meant that most individuals were earning more on unemployment than they were while working, boosting Americans’ savings accounts, and deterring many from returning to work.
-
24%
Those who say government aid packages during the pandemic incentivized them to not actively look for work -
21%
Those who say they never expect to be back to work full time
Source: U.S. Chamber of Commerce
Enhanced unemployment insurance and pandemic relief checks helped facilitate historic savings during the pandemic—as did the limited options for spending those savings as many normal spending options were unavailable, or significantly limited. Although those savings are coming down, in total, Americans saved about $2.7 trillion during the pandemic, 10% of the nation’s GDP.
Historically, layoffs and health emergencies stress Americans’ bank accounts and unemployed workers are eager to return to a steady paycheck. But during the pandemic, savings accounts broke with tradition and rose to unprecedented levels.
-
27 trillion
The amount Americans saved during pandemic, equal to 10% of the nation’s GDP
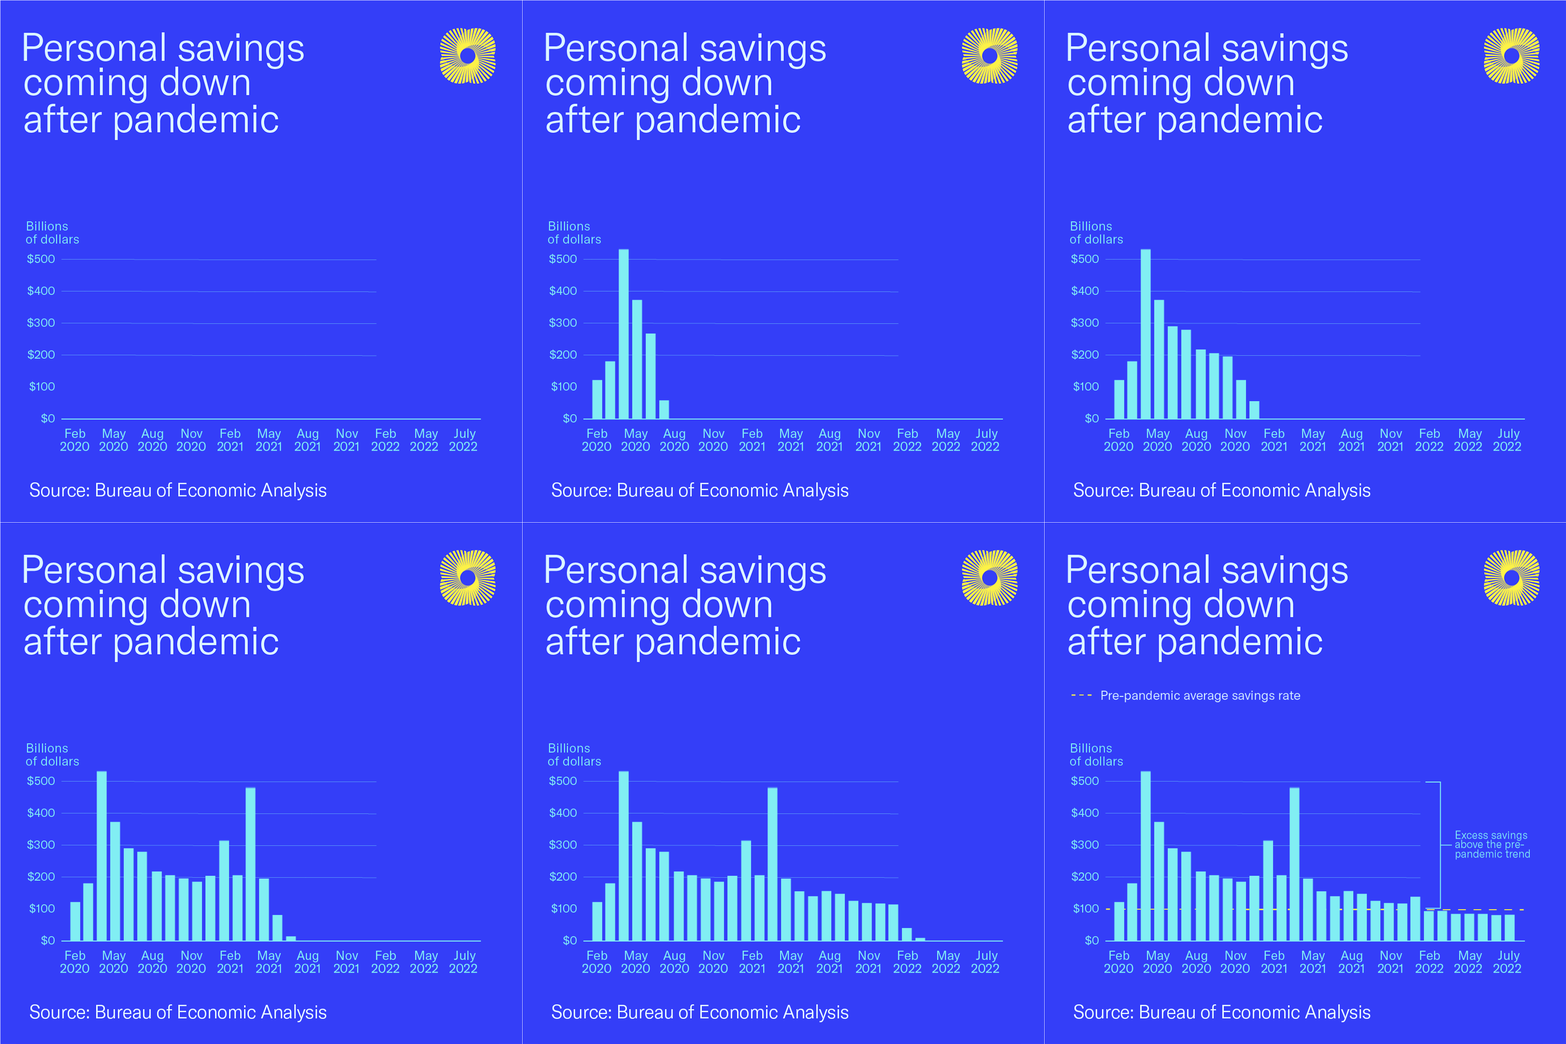
Despite savings dwindling, labor force participation has not gone up
Many Americans were able to live off the money they’d put aside, postponing a return to work. Now, more than a year out from pandemic checks and enhanced benefits, Americans are seeing their saving account dwindle with prices rising and spending on necessities resuming. But despite savings levels coming down, there has not been a substantial increase in the nation’s labor force participation.
The labor force participation rate still lags around one percentage point below where it was at the start of the pandemic, meaning nearly three million workers are still missing from the workforce.
Although there are other barriers keeping Americans out of work, like access to childcare, navigating the loss of government benefits when earnings or savings increase is a contributing factor keeping Americans out of work right now.
Navigating a loss in government benefits
Most states provide 26 weeks of unemployment benefits. During that time, unemployed individuals are required to look for suitable employment and are often matched with reemployment services. Not all claimants find work by the time their UI benefits end, however. In these cases, additional government programs become critical.
State and federal government benefit programs are available to assuage some difficult financial situations for low-income families and individuals. Benefits are administered at the state and federal level and most often are targeted toward a certain expense—food, care, and housing.
A majority (70%) of public benefits go to non-elderly people who work, and more than half of all workers in the bottom 20% of the wage distribution receive public benefits.
-
41 million
People receiving SNAP benefits in 2021 -
1 million
Families receiving TANF benefits in 2020
-
80.5 million
People enrolled in Medicaid and CHIP in 2021 -
2.2 million+
Families receiving housing choice vouchers in 2021
Source: Center on Budget and Policy Priorities; County Health Executives Association of California; The Pew Charitable Trusts

While many programs operate on a sliding scale, gradually phasing out as income rises (like SNAP benefits), some programs are terminated at the onset of increased earnings or accrued savings.
-
$10,326
Annual value of Medicaid benefits when earned income reaches $11,000 -
$7,552
Value loss of annual SNAP benefits when income reaches $35,000
The sliding scale and income thresholds lead to what is known as the “benefits cliff”—the point at which benefits are cut off. In some situations, the increased earnings do not make up for the loss in benefits. For this reason, some recipients are deterred from obtaining employment, working additional hours, or pursuing promotions and career development.
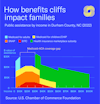
The two charts below from a report from the U.S. Chamber of Commerce Foundation describe the effect and severity of benefit cliffs.
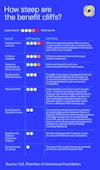
Take for example, public assistance in Durham County, North Carolina. Bundled public benefits decrease as earnings increase. However, if wages increase from $11,000 to $27,000 the family will experience a gap in health coverage between Medicaid and American Care Act subsidies because North Carolina is a non-expansion state for Medicaid.
“Qualitative research reveals important insights about how employees navigate benefits cliffs,” says Mathieu Despard, Ph.D., MSW. “A 2016 study of benefit recipients in Cincinnati found that none of the recipients made a job or career decision based on impending benefits cliffs. Instead, these workers said they needed help in making the transition from public benefits to wage gains, such as budgeting for food amidst a loss in SNAP benefits, and that they felt worse off financially despite wage gains. Though workers preferred not to receive public benefits, they felt unprepared in losing these benefits.”
A current snapshot of American’s financial wellness
The impact of benefits cliffs are especially relevant when considering the current financial wellness of Americans. With prices rising and pandemic savings dwindling, navigating benefits is more important than ever.
Debt levels are beginning to rise again
Debt levels declined during the pandemic, especially credit card debt. The drop in debt and rise in savings put consumers’ personal balance sheets in a strong position. However, debt levels are starting to rise as prices rise because of high inflation, the end of government pandemic benefits, and an increase in spending now that pandemic restrictions are mostly over.
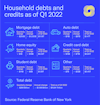
Further, many did not pay their rent or mortgages during the pandemic. That moratorium is over which means they now need to make these large payments. With savings accounts no longer growing, prices rising, and spending on necessities resuming, Americans will see rising levels of debt as interest rates are climbing.
From 2020 to 2021, overall debt levels have increased by 5.4%, according to the New York Federal Reserve. Credit card debt, however, decreased during the same timeframe. In 2021, Americans acquired mortgages, car payments, and personal loans while paying down credit cards.
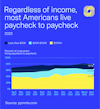
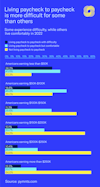
It’s also interesting to note that a majority (61%) of American consumers are living paycheck to paycheck. While this standard financial lifestyle is most common among those who earn the least, living paycheck to paycheck exists across all income levels. Nearly two-thirds of Americans are precariously close to financial distress should an emergency occur.
-
61%
Percentage of consumers living paycheck to paycheck -
79.9%
Percentage of consumers living paycheck to paycheck that earn less than $50k
-
63.8%
Percentage of consumers living paycheck to paycheck that earn $50k-$100k -
42.2%
Percentage of consumers living paycheck to paycheck that earn more than $100k
A proper social net should encourage and enable labor market entry, financial stability, and economic mobility. However, the steep benefit cliffs discourage labor market participation and promotion.
Changing the current framework would allow employers to fill open jobs and maximize productivity while also ensuring beneficiaries can reach self-sufficiency, build assets, and increase net worth. Policy changes that help achieve this balance include raising income limits, phasing out benefits more gradually, implementing continuous enrollment and transitional benefits, and eliminating asset tests.
A new report from the U.S. Chamber of Commerce Foundation takes a closer look at benefit cliffs and how proposed policy changes have affected the labor market when implemented in various states. Click here to read more.
