NASA Animations Demonstrate The Real Path of a Solar Eclipse

Statewide coverage of the August 2017 solar eclipse is brought to you by Shoshone Rose Casino and Hotel.
(Wyoming) NASA’s Scientific Visualization Studio has been ready for this summer’s solar eclipse for years.
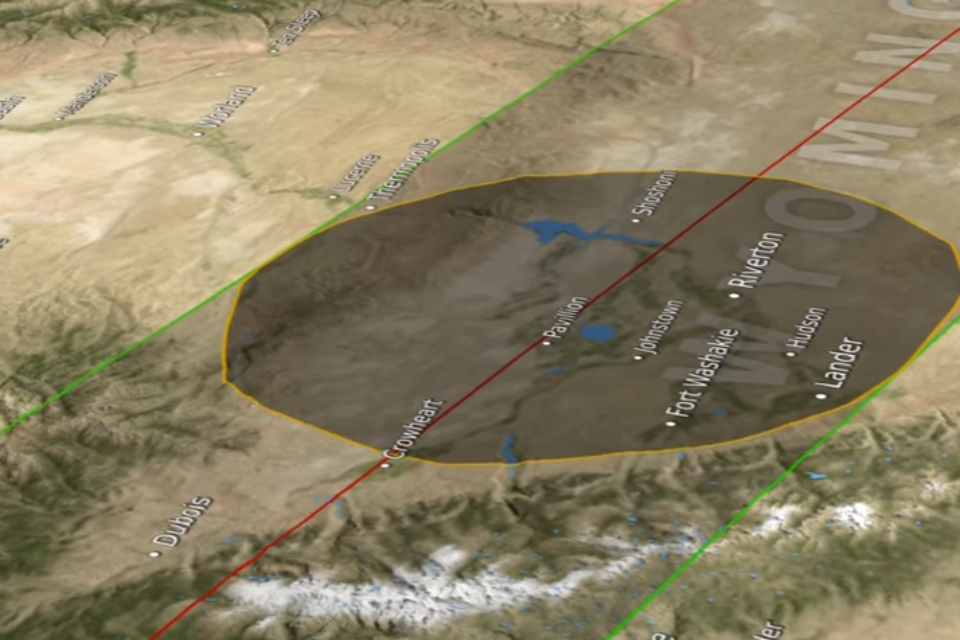
Posting on their blog in 2015, NASA Data Visualizer Ernie Wright created several animations demonstrating not only how the eclipse will look from outer space, but the actual shape of the moon’s shadow on the Earth. Usually, solar eclipse maps show the moon’s shadow as a perfectly round dot.
But depending on the terrain on the ground and the angle the sun is shining on the moon, the shape and size of the moon’s shadow changes.
“The math used currently to predict and map eclipses was first described by Friedrich Wilhelm Bessel in 1829 and was expressed in its modern form by William Chauvenet in 1863,” NASA states. “Bessel’s method for predicting eclipses pretends that the Moon is a smooth sphere, when in fact its terrain is more rugged and extreme than the Earth’s.”
NASA’s lunar orbiter and Japan’s Kaguya orbiter have been mapping the terrain of the moon for the past two decades in an effort to perfect its “limb profile”: the calculations used to define an exact outline of its shadow on the Earth.
A peak or valley on the moon can mean that the sun is blocked or peeks through earlier, later, longer or shorter, depending on what it’s passing over. This summer’s eclipse is the most accurately mapped one yet. Casper appears to be directly centered under the shadow of the moon, meaning it will be in total darkness for at least two minutes.
To see more animations and learn more about this summer’s eclipse event, visit NASA’S SVS page.


